
1. INTRODUCTION
We all have a secrets. It is in a human nature to keep some information to ourself and do not share with anybody else but close family or friends. It is true that we like to always keep a few cards in our sleeve and use them in right time just to gain advantage over someone.
We like to feel that we are better than others, we like to present ourselves in better light and keeping some information to ourself can make it happen. But, why are we doing the same to a census questions which are anonymous? We cannot do ‘better’ here? We are not able to score
higher than the rest, so why are we doing it? Are we ashamed of something? Or scared to admit that we might be not as good as ‘the rest’? Or, maybe it is in our nature? If so, do some of us are more prone to keep secrets than others?
Let check what society is trying to hide the most and who might be the most secretive person of us all - Person X.
1. LOCATION - CHECKING IF ALL PARTS OF IRELAND ARE EQUALY SECRETIVE
STEP I - CALCULATING THE SAMPLE SIZE AND SELECTING SAMPLING METHOD.
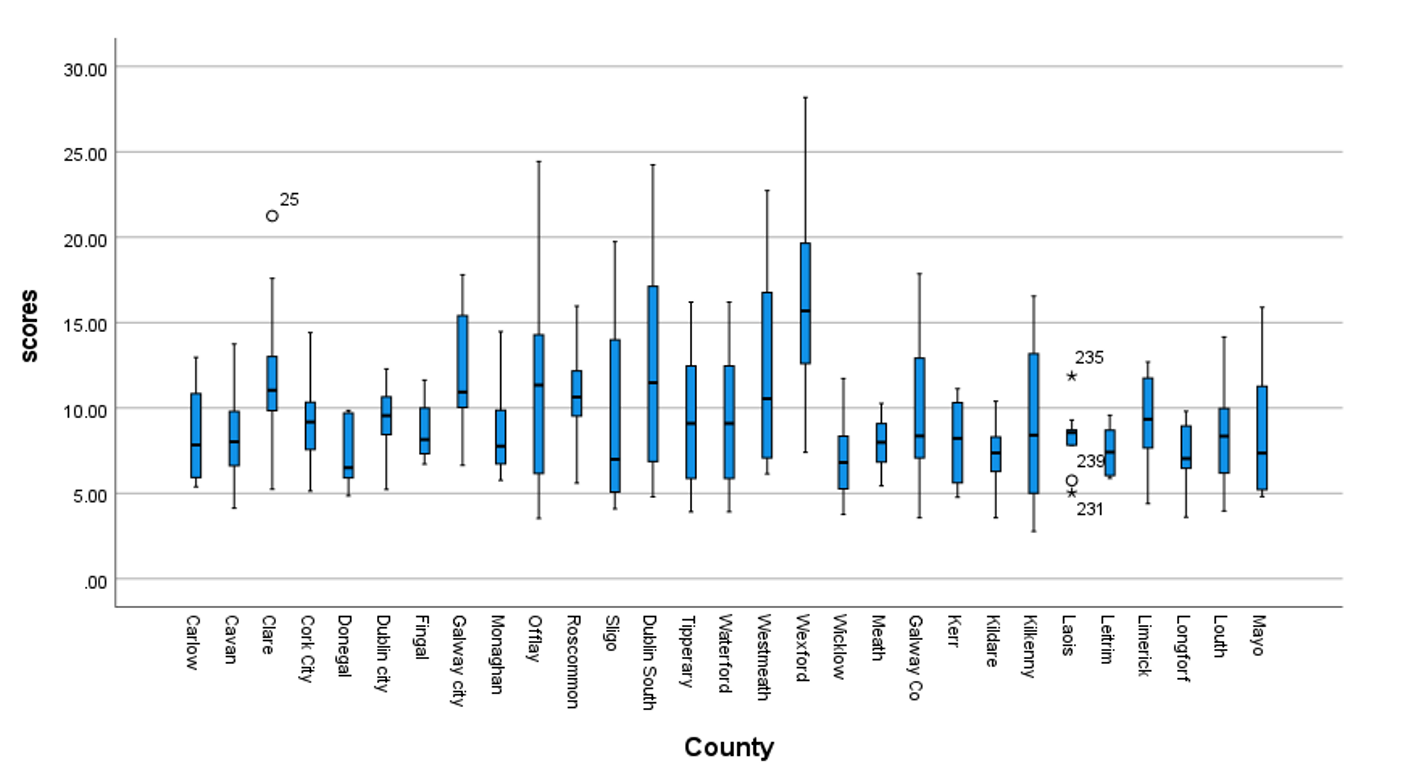
For the beginning of this analysis, we will have a closer look at census questions based on Small Area Population Statistics (SAPS) which were answered by people living in Ireland.
Data for each county is divided into multiple ‘small areas’ which represent a different number of dwellings therefore for more accurate results we are going to use percentage of total responds (by question in each county) as our data sets.
In census from 2016 there was 18 questions where person had option ‘Other’ or could write answer by himself but did not do it. Both of this answers were recorded as ‘not stated’ and that is exactly what we will be focusing on.
We want to check how secretive is population of Ireland therefore will start our analysis by creating sufficient sample size.
Small Area Population Statistics recorded 31 areas/counties and this will be our population size – N;
Confidence level = 95%
Margin of Error = 5%
Sample size = 29 (based on online calculator )
Using simple random sampling method all areas were assignes to a unique number and 29 numbers were pulled at random.
STEP II - CHECKING IF EACH COUNTY HAS A NORMAL DISTRIBUTION.
H0: all counties have approximately normal distribution
HA: at least one of the county has not normal distribution
alpha = 0.05 - most suitable for social studies
We will accept H0 if Sig > alpha and reject if H0 Sig < alpha.
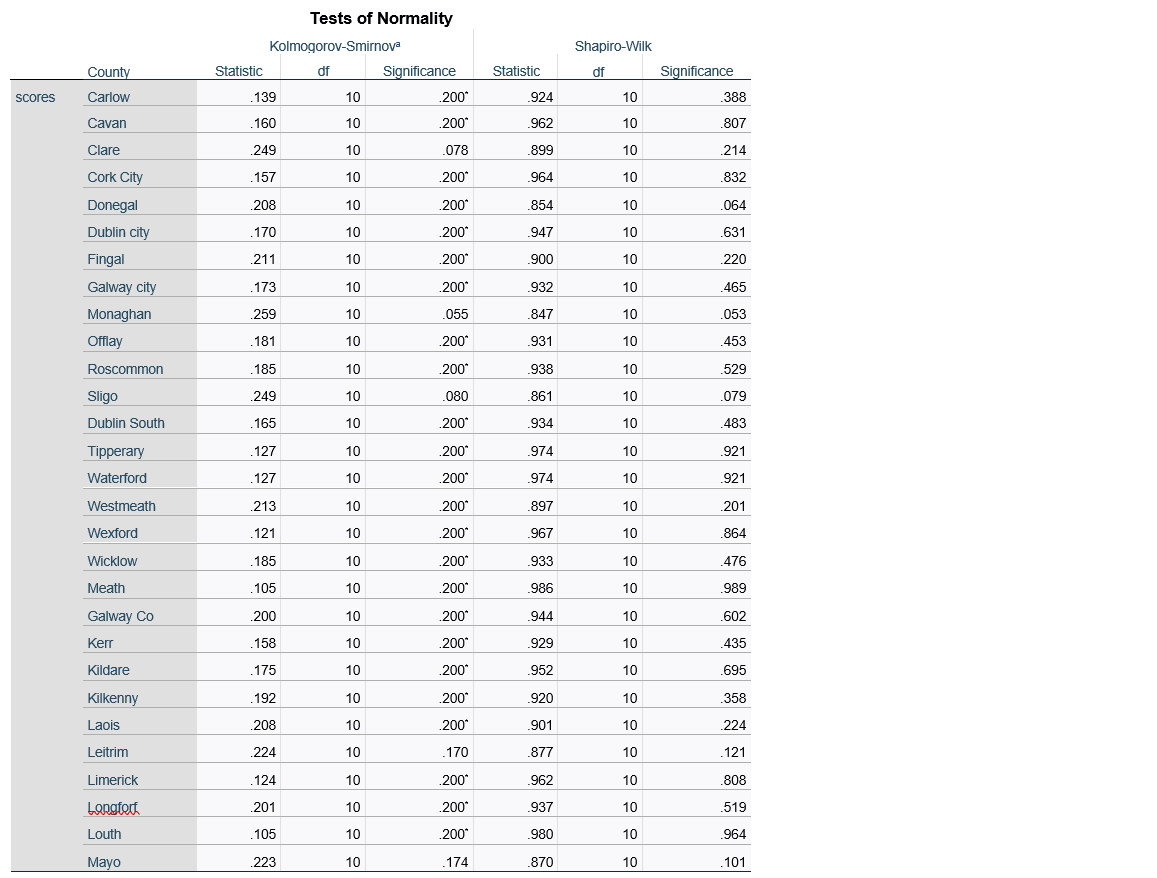
Looking at the Shapiro – Wilk test results we can see that significance for every county is higher than alpha = 0.05 which means we accept H0.
CONCLUSION:
All counties have approximately normal distribution.
DISCLOSURE: to avoid Type II Error sample size within each county should be increased from 10 to a suitable proportion of county data in Small Area File.
STEP III – LOOKING FOR THE VARIANCE BETWEEN AREAS
Is any of the county more secretive than the other? In order to answer this question we will have to look at the difference between them. Is there any difference and if so, which county likes to keep secrets.
We have 29, independent, random samples with normal distribution therefore best test would be One-Way Anova but we are failing variance requirement. Because our samples are small and variance between each sample is not equal we will proceed with Kruskal-Wallis test.
H0: sample median are equal
HA: sample median are not equal
alpha = .05
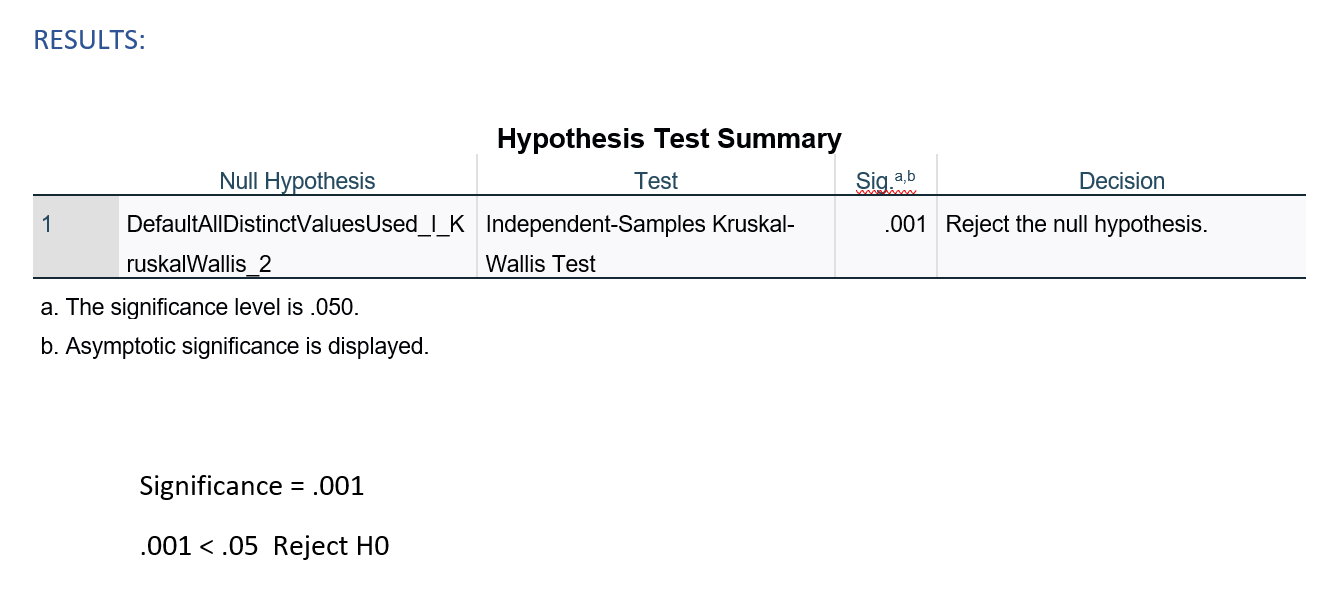 Significance = .001
.001 < .05 Reject H0
Significance = .001
.001 < .05 Reject H0
Kruskal-Wallis Test results shows that not all medians are equal => there is a difference between counties median.
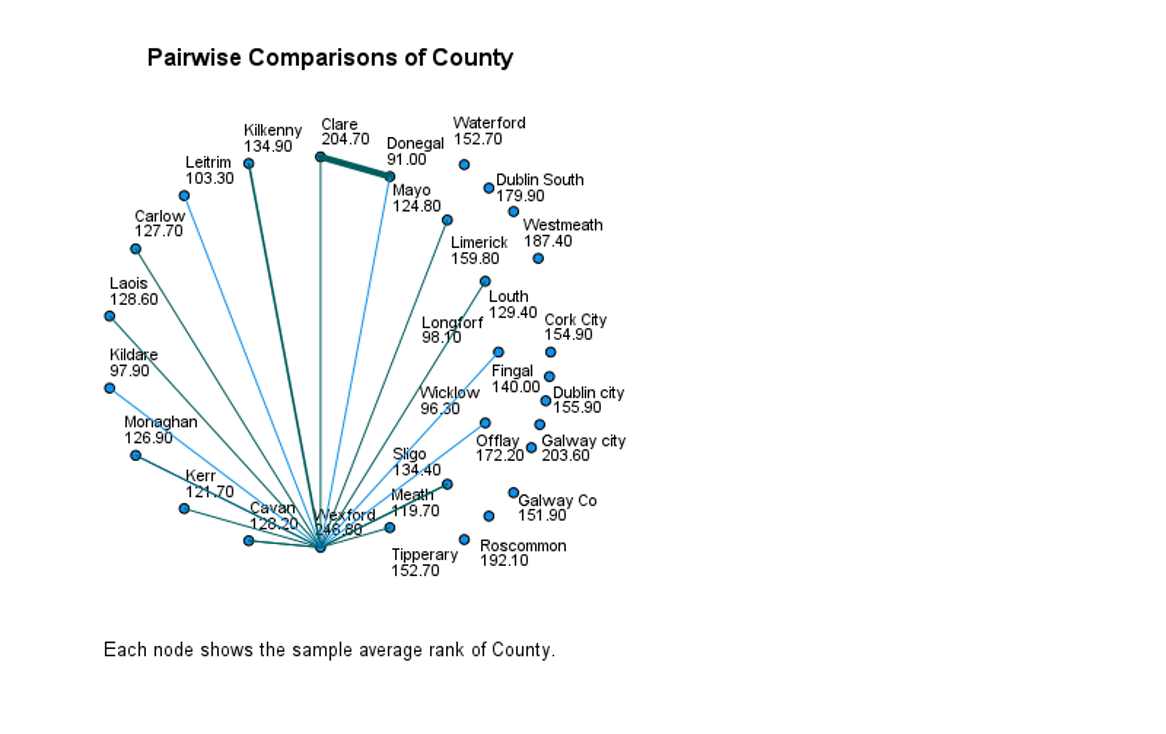
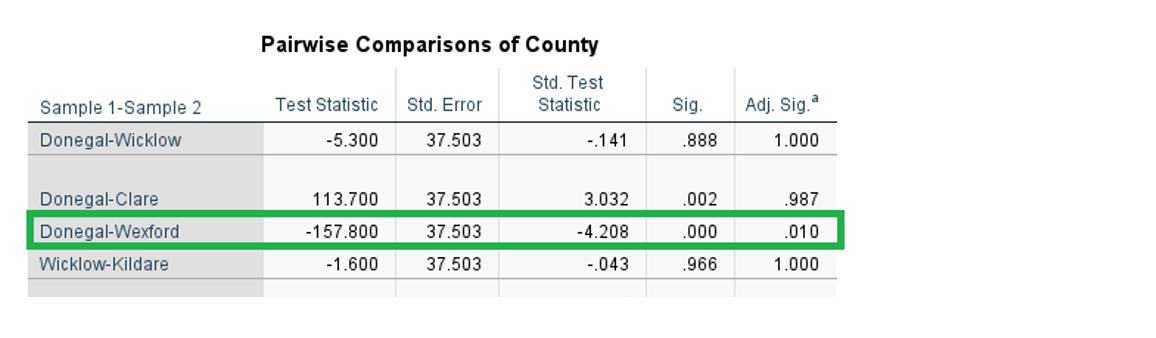
CONCLUSION:
Population of Ireland is not equally secretive and some counties prefer not to answer questions at higher level than others. Biggest difference is between Wexford and Donegal.
2. NARROWING THE LOCATION
Results above shows that there is significant difference between counties in whole Ireland, but will it be the same withing one county? If one county will be divided into smaller groups will all parts have different level of secrecy?
Interdum et malesuada fames ac ante ipsum primis in faucibus. Pellentesque venenatis dolor imperdiet dolor mattis sagittis. Praesent rutrum sem diam, vitae egestas enim auctor sit amet. Pellentesque leo mauris, consectetur id ipsum sit amet, fersapien risus, commodo eget turpis at, elementum convallis elit. Pellentesque enim turpis, hendrerit tristique lorem ipsum dolor.
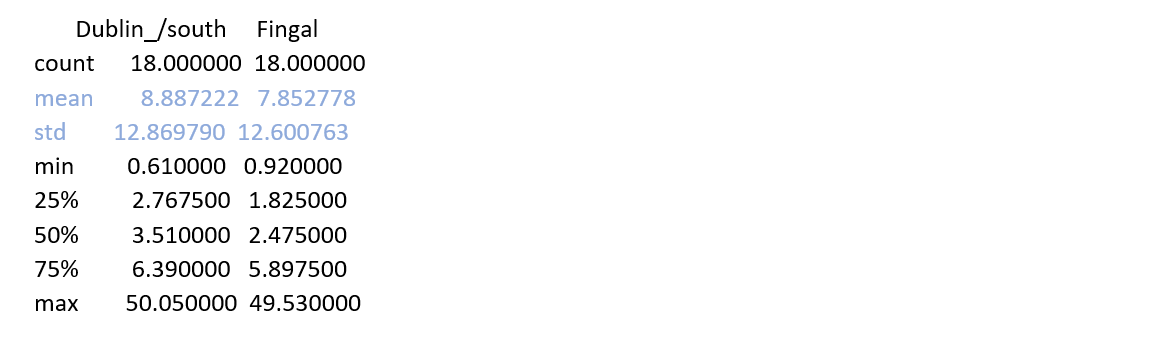
To answer this question we will compare counties of Dublin, in more specific: Dublin South and Fingal.
Using Python code we can produce descriptive for both samples.
STEP I - CHECKING IF EACH COUNTY HAS A NORMAL DISTRIBUTION.
H0: all counties have approximately normal distribution
HA: at least one of the county has not normal distribution
Best way to check normality of smaller samples is Shapiro Wilk test. We will accept H0 when p-value will be > alpha and reject when p-value will be < alpha.
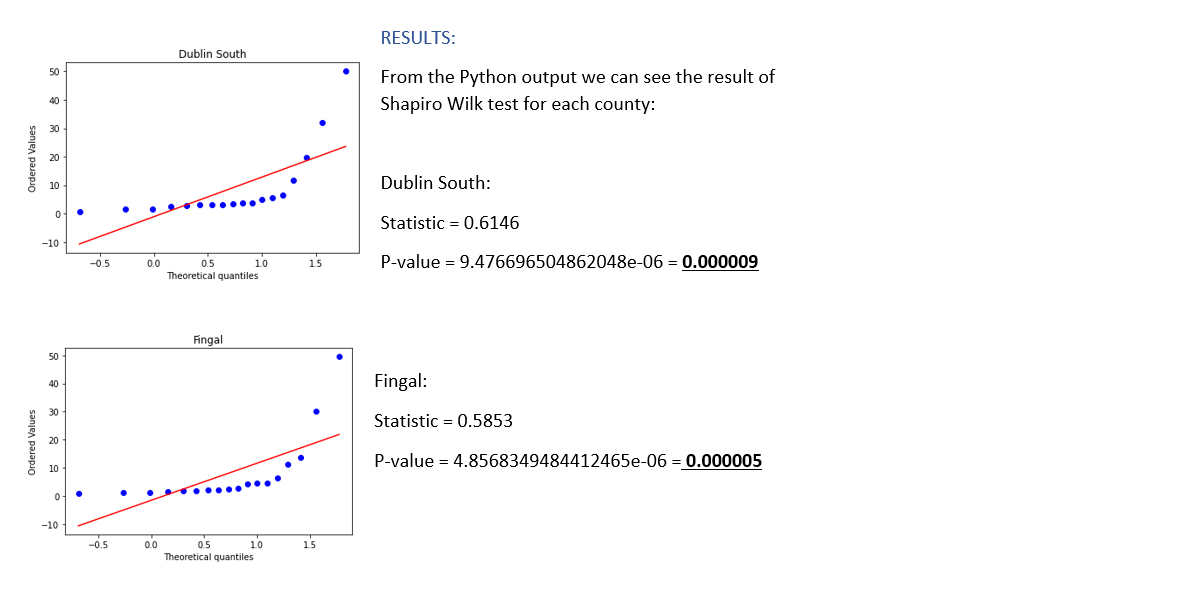
The p-values for both counties is smaller than alpha = .05 therefore we reject H0.
CONCLUSION:
Results show that none of the counties have a normal distribution.
STEP II - LOOKING FOR THE VARIANCE BETWEEN DUBLIN’S COUNTIES
We have 2 small, random, continuous samples with not normal distribution, taken from the same area, which I will assume, depends/pair together at some level – best test will be Wilcoxon Signed Rank Test.
H0: median difference between 2 counties is zero
HA: median difference between 2 counties is not zero
n = 18; alpha = .05
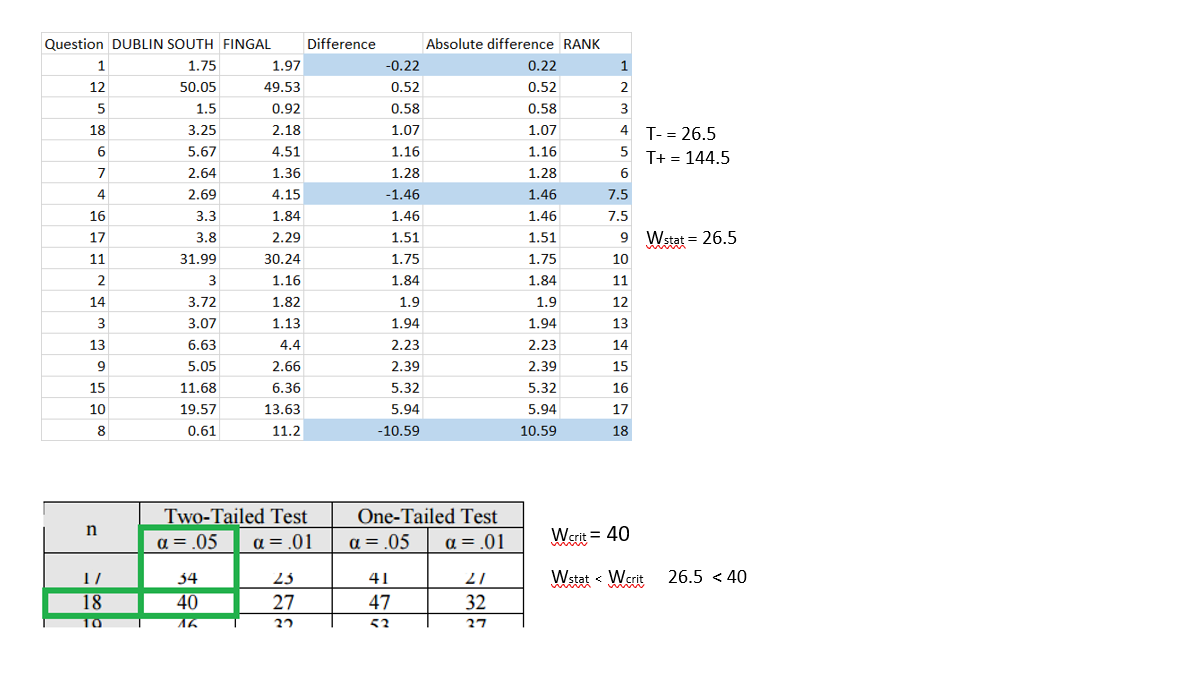
Based on results we are going to reject H0.
CONCLUSION :
Our Wilcoxon Signed Rank Test results shows that there is a difference in medians between South Dublin and Fingal which means that there is a difference between South Dublin and Fingal regarding not answering questions.
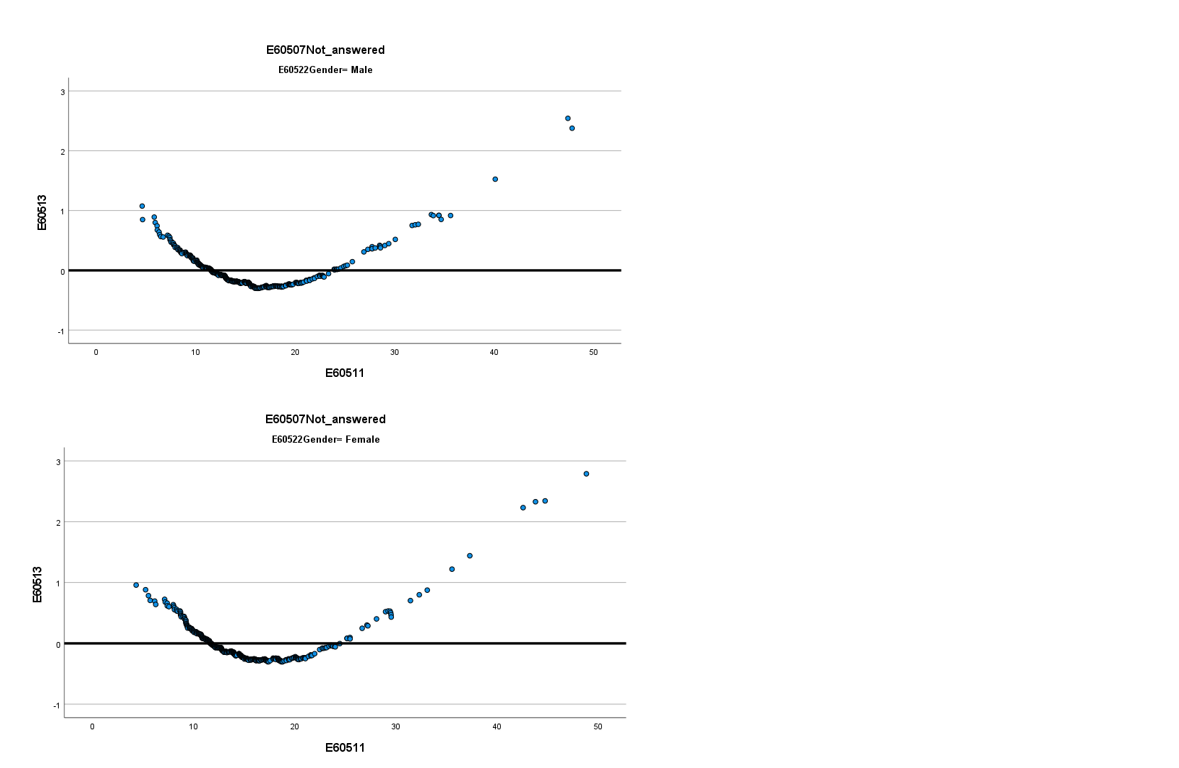
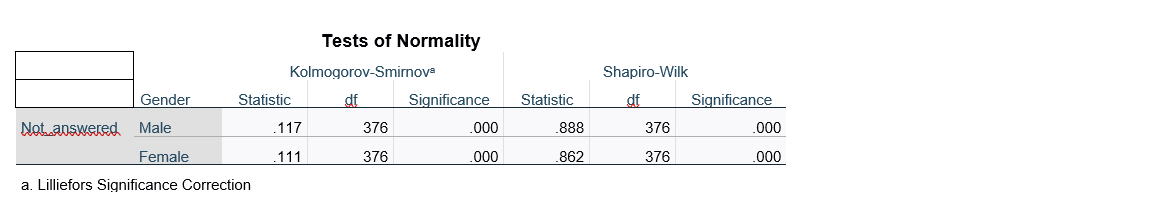
3. GENDER
In this part of analysis we will focus on gender, are Females more or less secretive than Males? Or are we prefer not to share some information at the same level?
STEP I – CALCULATING SAMPLE SIZE AND CHOOSING SAMPLING METHOD
Small Area Population Statistics has 18600 records,
N = 18600
Confidence Level = 95%
Margin of Error = 5%
n = 376
Since there is no gender related pattern, best method for this sampling will be systematic sampling where data is organised in order. One random small area was chosen as a starting point and next 375 small areas were choses every 50th row in data set.
We have 9 questions with possible answer ‘Not Stated’ or ‘Other’ which were divided by a gender. Answers from those questions were calculated as percentage of total responds for the question and calculated average for each of Small Area was taken.
STEP II - CHECKING IF GENDER SAMPLES HAVE NORMAL DISTRIBUTION
H0: both genders have approximately normal distribution
HA: at least one gender has not normal distribution
We will accept H0 if Sig > alpha and reject if H0 Sig < alpha.
Both gender’s p value / Significance is lower than alpha = 0.05.
CONCLUSION :
Both groups have not normal distribution.
STEP III – CHECKING IF THERE IS SIGNIFICANT DIFFERENCE BETWEEN MALE AND FEMALE REGARDING TO NOT ANSWERING QUESTIONS.
We have 2 independent, big samples with not normal distribution therefore best test for checking difference between them will be Mann – Whitney U Test.
H0: there is no difference between gender
HA: there is difference between gender
We will accept H0 if Sig > alpha and reject if H0 Sig < alpha.
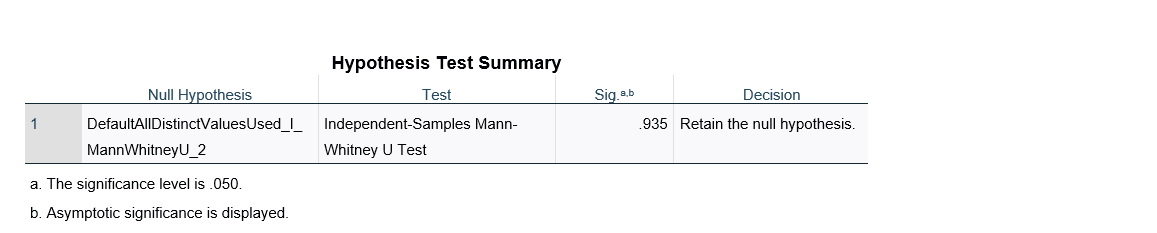
Mann-Whitney U Test Sig. > .05 therefore we will accept H0.
CONCLUSION :
Test results strongly indicates that there is no difference between gender regarding to not answering census questions.
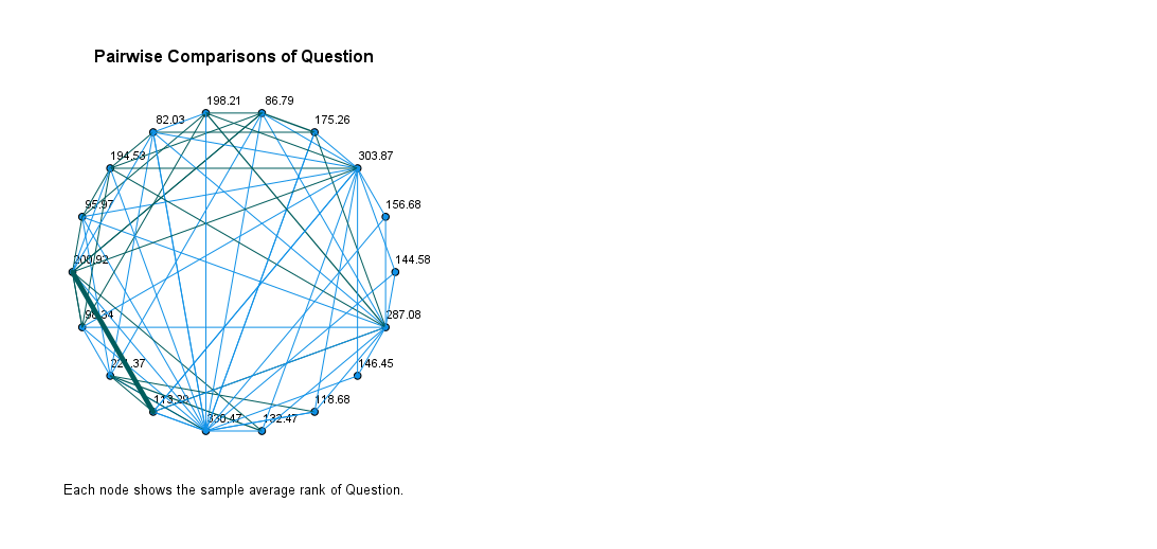
4. QUESTIONS – WHAT IS THE SUBJECT ARE WE TRYING TO HIDE THE MOST?
It is commonly known that there are some sensitive subjects which people are trying to avoid. We will not talk about them, ask questions and will not answer if any sensitive to us topic will arise. It is in our nature.
But what subject is sensitive to us in census?
In this part we are going to analyse each question where population of Ireland could select ‘Other’ or not answer at all. We are assuming that the person by choosing option ‘Other’ do not want to answer the question as a main reason - rather than lack of variety of answers.
STEP I – CHECKING NORMALITY OF EACH SAMPLE
H0: all questions have approximately normal distribution
HA: at least one of the question has not normal distribution
We will accept H0 if Sig > alpha and reject if H0 Sig < alpha.
Shapiro Wilks results from Python output:
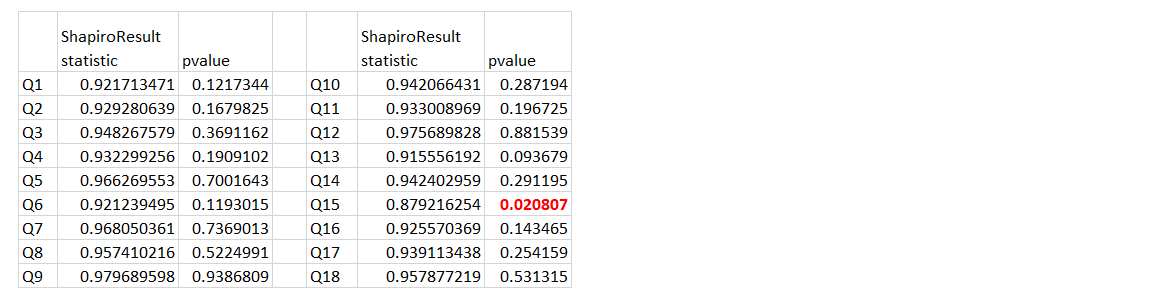
P-value for question 15 is < alpha therefore we will fail to accept H0.
CONCLUSION :
Not all samples have approximately normal distribution.
STEP II – COMPARING IF ALL QUESTIONS ARE NOT BEEING ANSWERED AT THE SAME LEVEL
In Small Area Population Statistics file we have 18 questions where answers were logged as ‘Other’ or ‘Not stated’. We will be looking for a difference between questions.
We have 18 samples, with not normal distribution – best test will be Kruskal Wallis H test.
H0: sample median are equal
HA: sample median are not equal
We will accept H0 if Sig. > alpha and reject if Sig. < alpha ; alpha = .05.
Python output for Kruskal Wallis H test shows:
H: 187.13831273199932 , p-value: 1.0853988671552265e-30
Significant difference between the Questions is found.
CONCLUSION:
Results of the test concludes that not all questions are ‘not answered’ at the same level. People decided not to answer to some questions more often than to other.
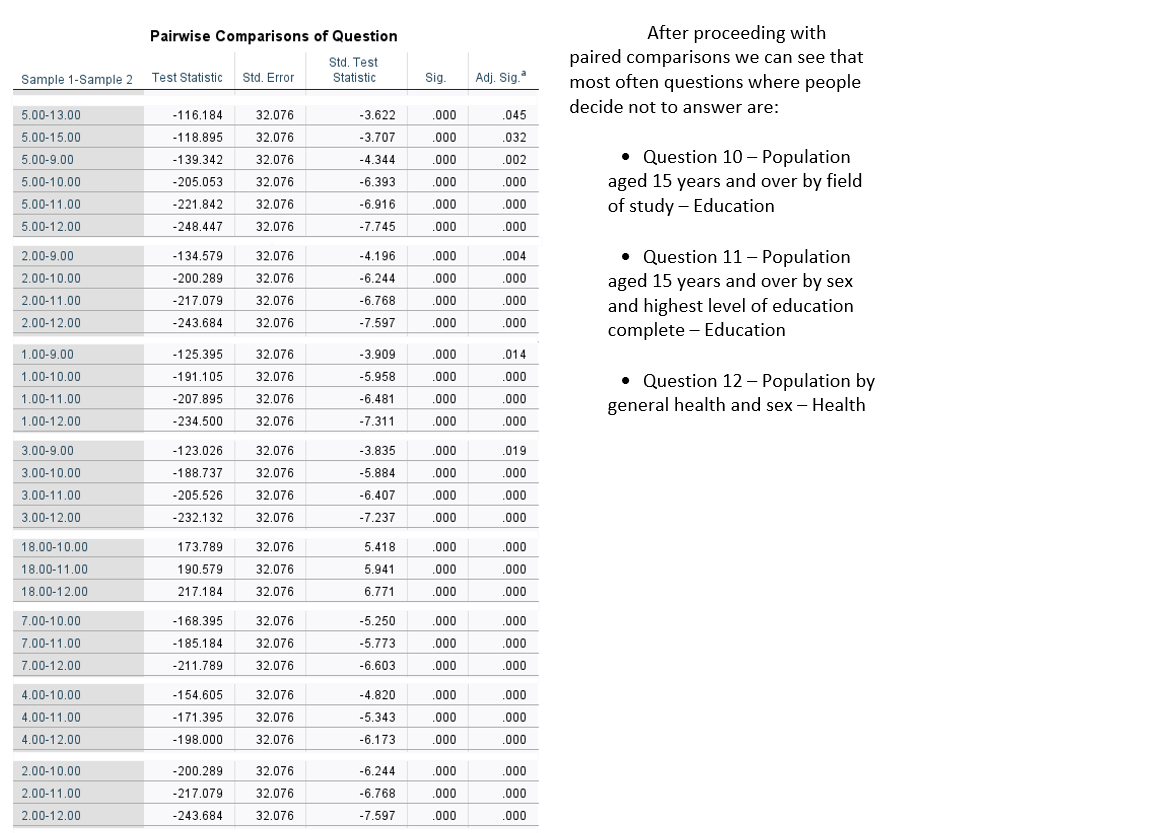
5. TESTING – is it true that Wexford is more secretive than ‘the REST’?
In our first test we concluded that county Wexford is more secretive than other. We took 10 random small areas from each county, calculated average from each and that was our sample for each county.
Now we will compare responses for each question. We are going to check if Wexford don’t answer particular question at similar level as the whole population.
We want to measure the discrepancy between Wexford and the population’s level of not answering questions - the best test to do is Chi Square test (Goodness of fit).
We start with population sample n = 376, calculating average percentage for each question, and this will be our EXPECTED value.
Wexford average percentage for each question will be OBSERVED value.
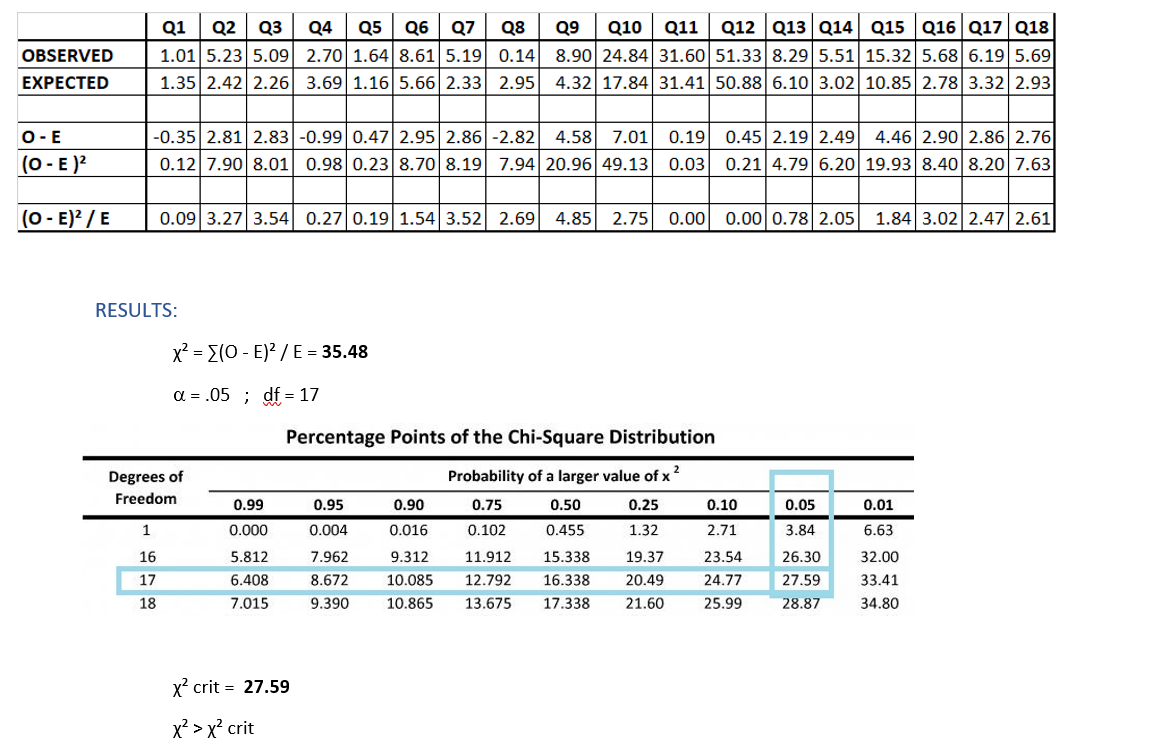
Wexford do not follow population distribution and answers questions at different level than population.
CONCLUSION:
Wexford is truly more secretive than the rest of Irish population.
6. SUMMARY
At the beginning of this analysis we stated that we all have secrets and we do not like to share some information in general.
Based on Small Area file, we conducted statistical tests and discovered that each county do not answer question at different level and Wexford is the most secretive area of Ireland. People living there, on average, are more likely to chose answer ‘Other’ or not answer to question at all, than the rest of population.
Similar results were founded after performing test on Dublin area. Different parts of Dublin have different level of secrecy.
We found out as well that the most sensitive subject is Education and Health. Questions relating to this subjects were left unanswered the most.
Another test results showed that there is no difference between female and male in secrecy level. Unfortunately data set did not allow us to perform any further analysis and we were unable to discover who is the most secretive person from us all. Characteristics on Person X remaining unknown.
(Unless, Person X is so secretive that, did not respond to census questions at all.)