EXAMPLE:
Traffic data from the Road Safety Authority (21.07.2016) shows the distribution
of fatal road accidents in Ireland by day of the week is as follow:

Assuming that it is expected to have and an equal number of accidents to happend on each day.
Based on these data,
is there evidence that the number of fatalities on a daily basis differs from what is expected?
One Sample Chi-Square test (Goodness of Fit):
- Measure the discrepancy between the observed results and some hypothetically expected results.
- Observed values - values of the observations (experiment)
- Expected values - it is a propability
TESTING
- H0: Observer data fit to the population (total fatality accidents) distribution.
- H1: Observed data differ, does not follow population distribution.
- alpha = .05
I will accept H0 if Chi Sq Stat value < Chi Sq Crit
and refuse in Chi Sq Crit > Chi Sq
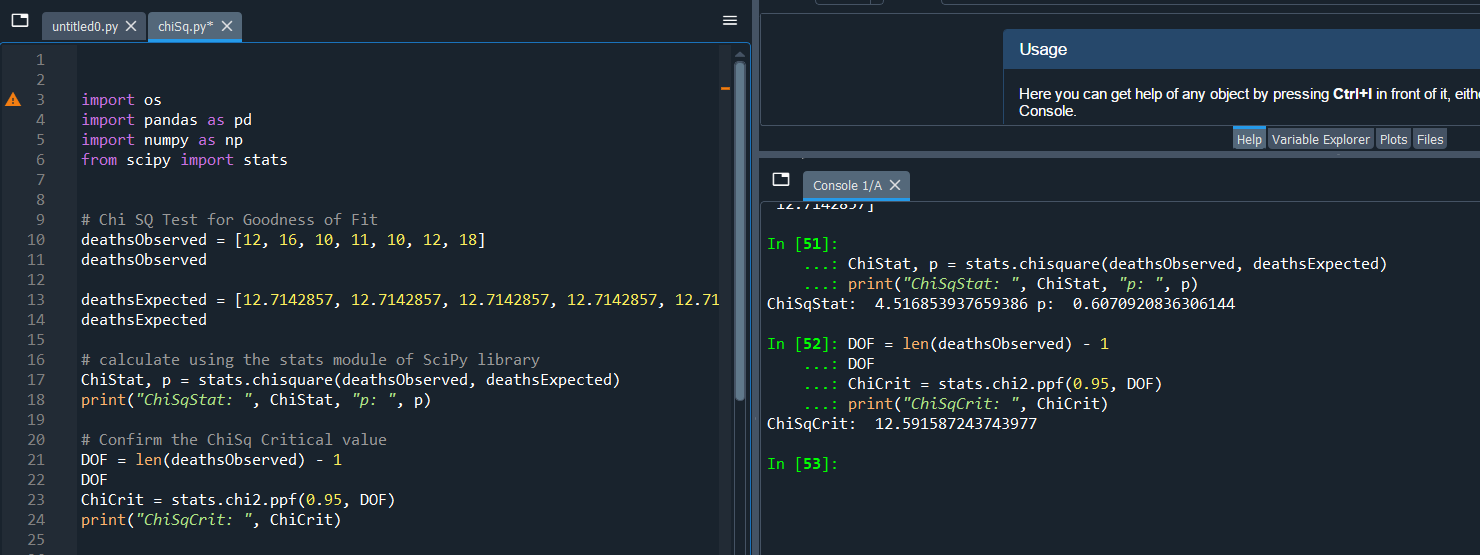
RESULTS:
Results from Python shows that:
ChiSqCrit: 12.5916
ChiSqStat: 4.516853937659386
p: 0.6070920836306144
Chi Sq Stat < Chi Sq Crit
p-value > .05
Fail to reject H0
INTERPRETATION:
Collected data ( one week in July 2016 ) truly represents distribution for fatal road accidents during a week time.
Which means, despite 18 fatal accidents on Saturday that week, it
was within acceptable limits.