Binary results prediction - Logarithmic Regression
EXAMPLE:
Dataset shows whether or not college basketball players got drafted into the NBA
(draft: 0 = no, 1 = yes) based on their average points per game and division level.

TESTING:

Nagelkerke R Square = .725
The percentage of the variation in the response variable that can be explained by the predictor variables. In this case, points and division are able to explain 72.5% of the variability in draft.

Overall Percentage = 85.7
The logistic regression model was able to correctly predict the draft result of 85.7% of players.
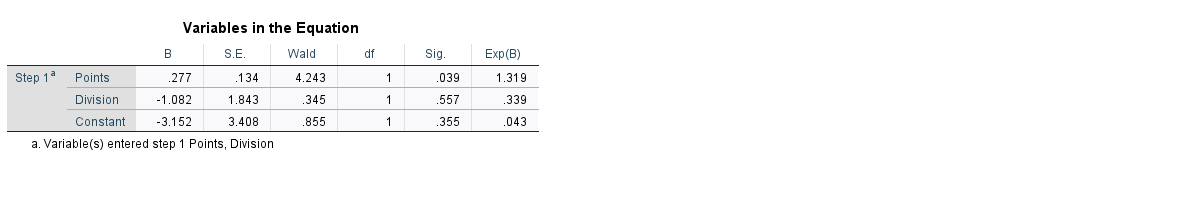
The Wald test statistic for each predictor variable, which is used to determine whether or not each predictor variable is statistically significant.
Sig: The p-value that corresponds to the Wald test statistic for each predictor variable. We see that the p-value for points is .039 and the p-value for division is .557.
Exp(B): The odds ratio for each predictor variable tells us the change in the odds of a player getting drafted associated with a one unit increase in a given predictor variable.
EXPLANATION:
The odds of a player in division 2 getting drafted are just .339 of the odds of a player in division 1 getting drafted.
Similarly, each additional unit increase in points per game is associated with an increase of 1.319 in the odds of a player getting drafted.