EXAMPLE:
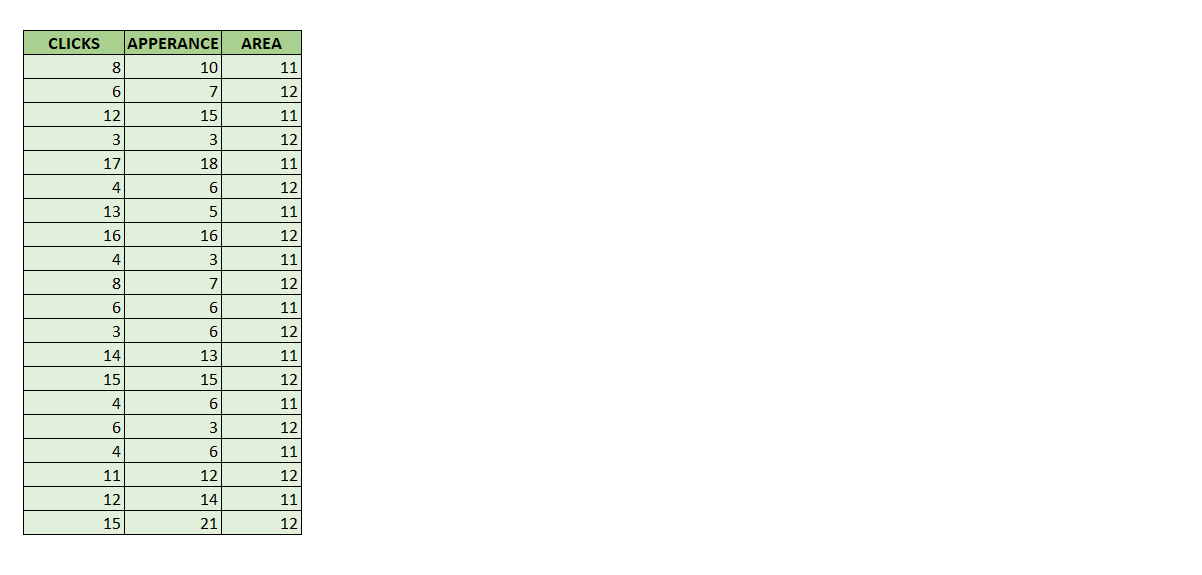
Company wants to predict results (amounts of clicks) of future posts on a social media platform.
Two factors were taken into account:
1. Appearance of the post.
2. Area - location.
TESTING:
1.
Starting from correlation between variables:
H0: There is no relationship between the independent variables and the dependent variable (CLICKS).
H1: There is a relationship between them.
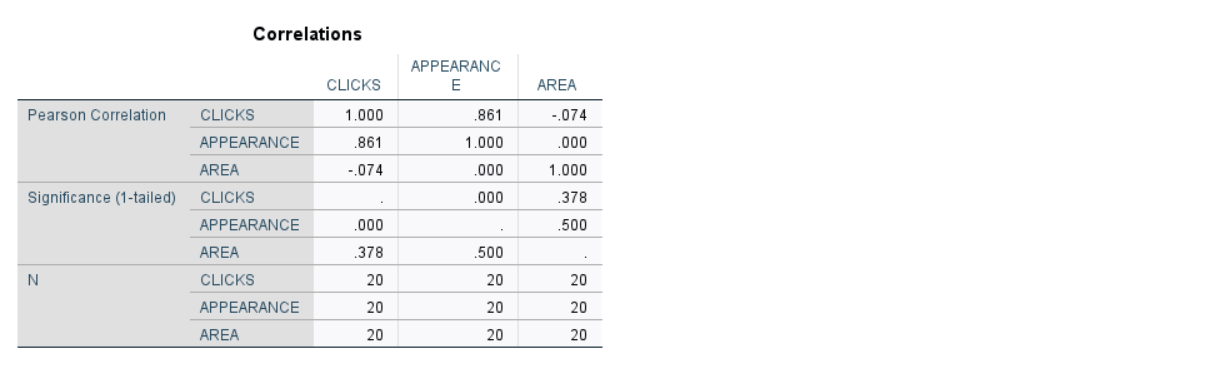
Correlation between amount of clicks and area is low (-.074).
Correlation between amount of clicks and appearance of the post is high (=.861).
2.
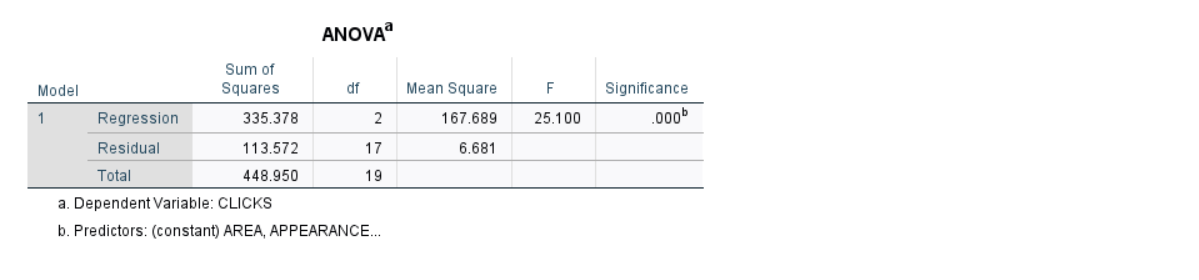
The probability of the F statistics 25.100 for overall regression Signifiance is less than .05,
which means that there is a statistically significant difference between the dependent and independent variables.
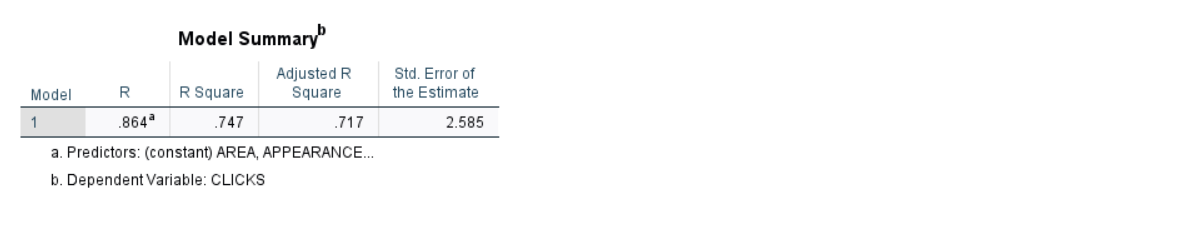
The Multiple R for the relationship between the set of independent variables and the dependent variable is strong (0.689).
3.
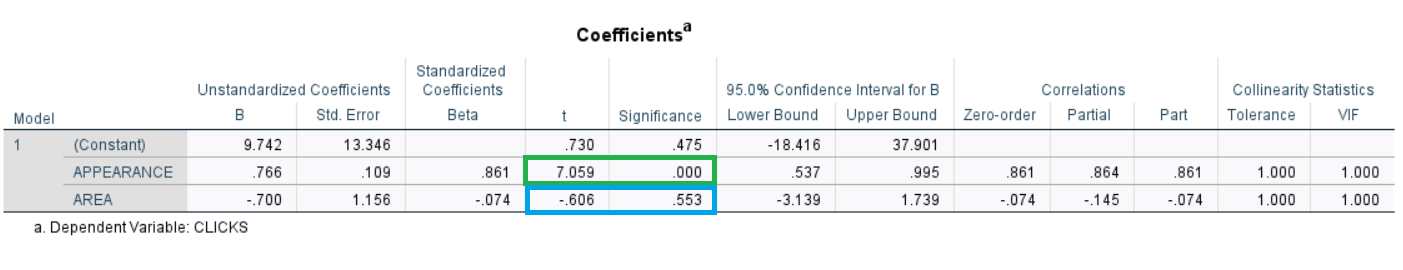
Significance for APPEARANCE is 0.000 ( < .05) which means there is significant difference between appearance and number of CLICKS.
Significance for AREA is 7.059 ( > .05) which means that there is no statistically significant
difference between CLICKS and AREA.
RESULTS:
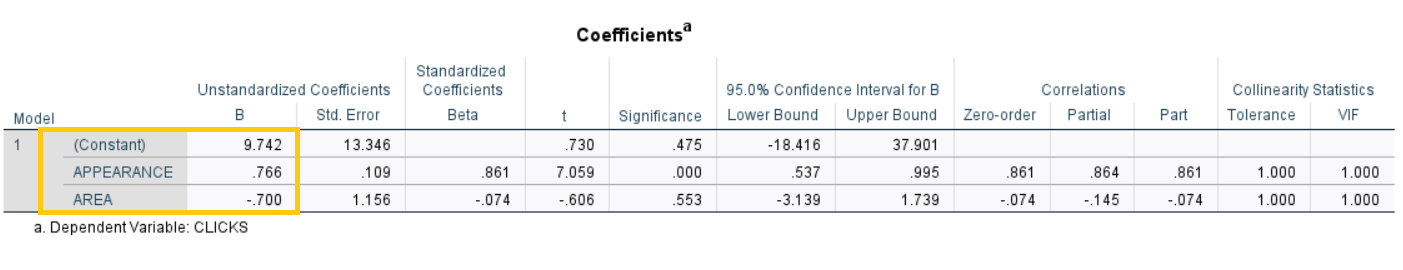
CLICKS = y
CONSTANT (a) = 9.742
APPEARANCE = .766
AREA = -.700
y = 9.742 + 0.766x1 - 0.700x2
x1 = 10
x2 = 11
y = a + bx1 +bx2
y= 9.742 + 7.66 - 7.7 = 9.702
EXPLANATION:
Post with APPEARANCE = 10 and AREA = 11 should receive 10(rounded) clicks.