How well does it compare with others?

- comparing piece of something to the whole 'picture'.

What does it mean and when is used?
Sample comparison is very common procedure when we are testing how well something or someone is performing in compare to the rest of the group.


EXAMPLE:

Manager of the shop noticed that one employee ‘A’ is constantly talking to his colleagues while he should serve the customers. He decided to check his sells performance in comparison to the rest of the employees.

Z-TEST:

Manager randomly selected 36 dates when employee ‘A’ was working as a cashier and calculated his ATV (Average Transaction Value per day) and what was his standard deviation. Next he check ATV for all his employees and their standard deviation.

Employee ‘A’ records = n
ATV = Mean
Difference = Standard Deviation

At first glance it may appear that Employee ‘A’ is doing quite well but to make sure, manager proceed with calculations.


HYPOTHESIS:

STEP I : State the null and research hypotheses.

  • H0: the average of employee ’A’ is the same as the rest of the team.
  • H1: the average is different. Employee ‘A’ is either better or worse than the other employees (together as a group - population).
  • Significance level of alpha = .05
  • Sample size : n = 36

    STEP II : Level of significance.

    Manager decided that 0.05 of significance is enough for him. He will have 95% confidence in his results. (alpha = 0.05) He checked as well SEM (Standard Error Means) and started his calculations.


    RESULTS:

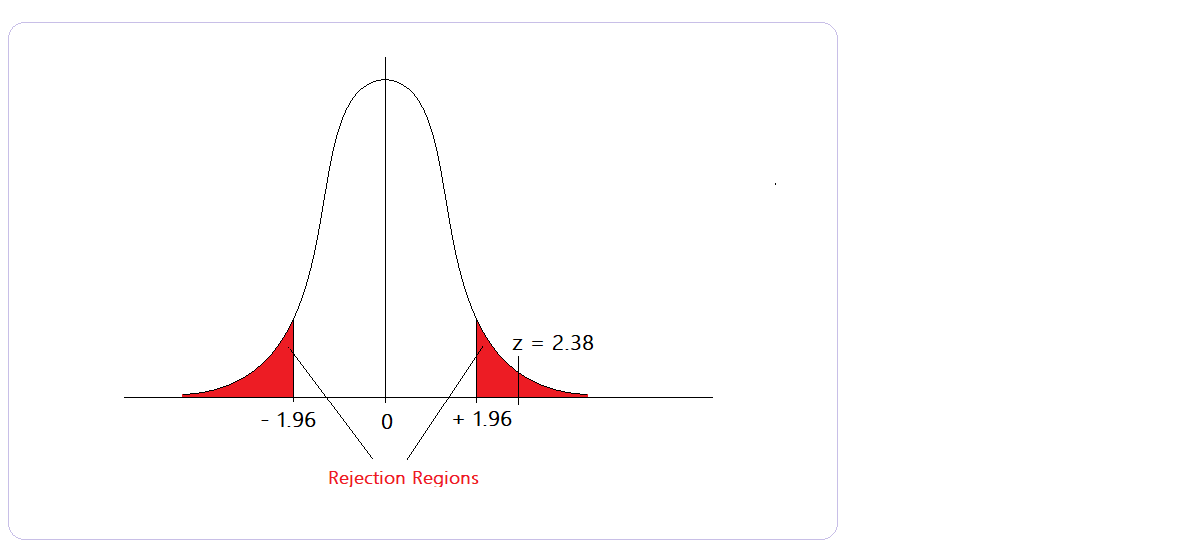
    Critical value for alpha is 1.96, obtained value Z is 2.38

    Manager should accept H0 if Z value would be anywhere between - 1.96 and +1.96. This would mean that performance of employee 'A' is at the same level as the rest of the employees.

    Since Z is more extreme than alpha, manager understood that Employee ’A’ is performing much better then the rest of his colleagues.